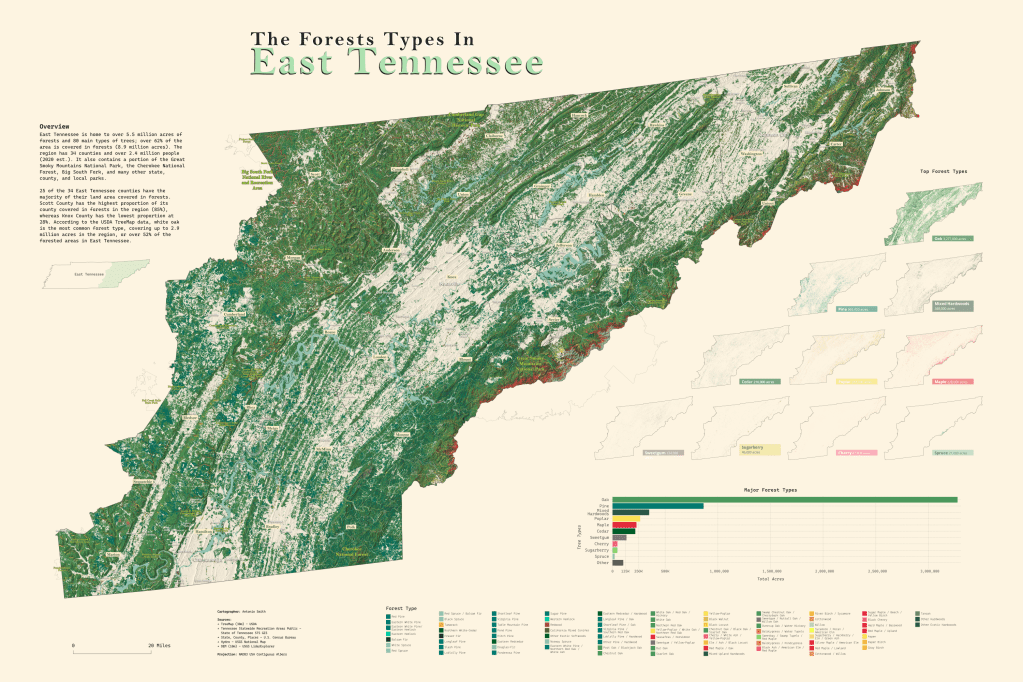
East Tennessee is home to over 5.5 million acres of forests and 80 main types of trees; over 62% of the area is covered in forests (8.9 million acres). The region has 34 counties and over 2.4 million people (2020 est.). It also contains a portion of the Great Smoky Mountains National Park, the Cherokee National Forest, Big South Fork, and many other state, county, and local parks.
25 of the 34 East Tennessee counties have the majority of their land area covered in forests. Scott County has the highest proportion of its county covered in forests in the region (85%), whereas Knox County has the lowest proportion at 28%. According to the USDA TreeMap data, white oak is the most common forest type, covering up to 2.9 million acres in the region, or over 52% of the forested areas in East Tennessee.
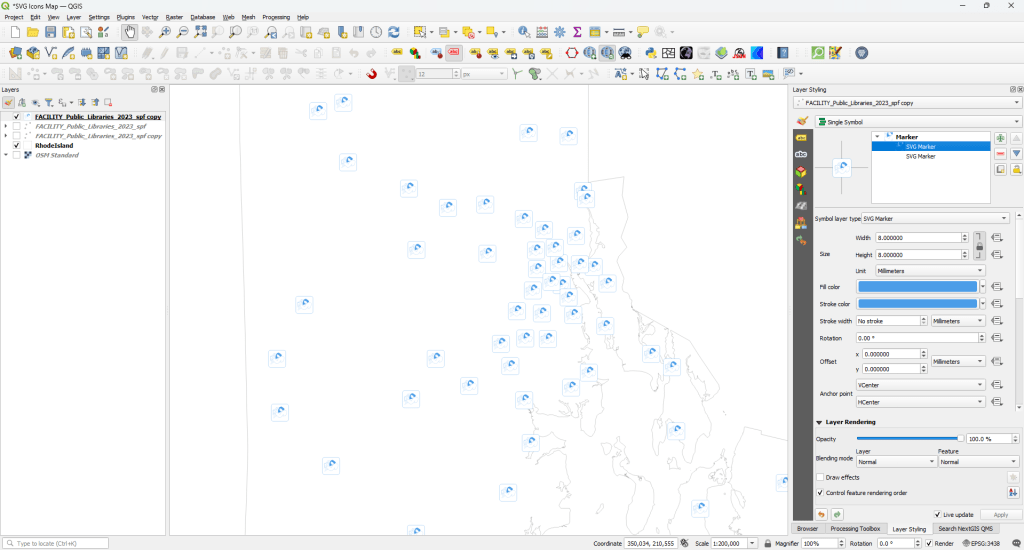
This map was created using QGIS and R. The TreeMap and DEM raster layers were clipped to the East Tennessee boundary. Later, the small multiples map was generated by reclassifying the TreeMap to filter out all other forest types.
This map is primarily based on the USDA TreeMap (2016) raster dataset. The raster is a 30-meter resolution discrete layer showing the forest coverage by tree species. To reduce complexity, the tree species were combined by type (e.g., oak, pine, poplar, etc.) via the color ramp for the main map, and the reclassification for the small multiples to filter the other forest types. New colors were chosen based on the color of the tree leaf in autumn, sans the oak forests, which have many subspecies.
| Map Size | 34 x 24 in (ARCH D) |
|---|---|
| Map Scale | |
| Map Projection | USA Contiguous Albers (NAD 1983) |
| Data Sources | USGS Lidar Explorer, USGS National Hydrography Dataset, U.S. Census Tiger Files, USDA TreeMap, TNGIS |
| Tools | QGIS: General data processing, map creation, and final map assembly RStudio: Data processing and chart creation Affinity Designer: Chart editing |