Overview
Week 4 of the 30DayMapChallenge recap.
As a reminder, I decided to focus a single area of interest (AOI) for most of my maps: Rhode Island. There are a couple of exceptions this week.
https://30daymapchallenge.com/
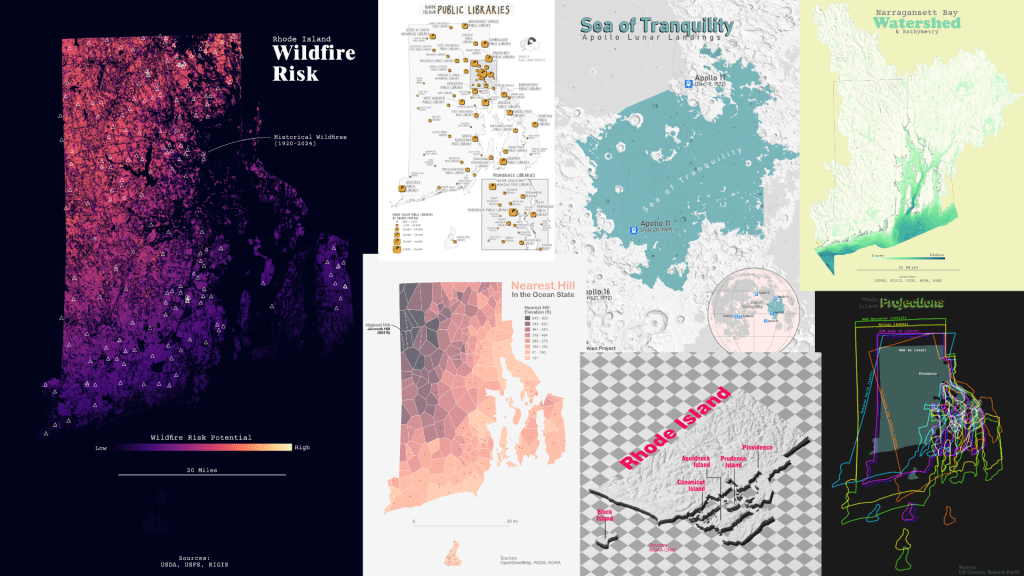
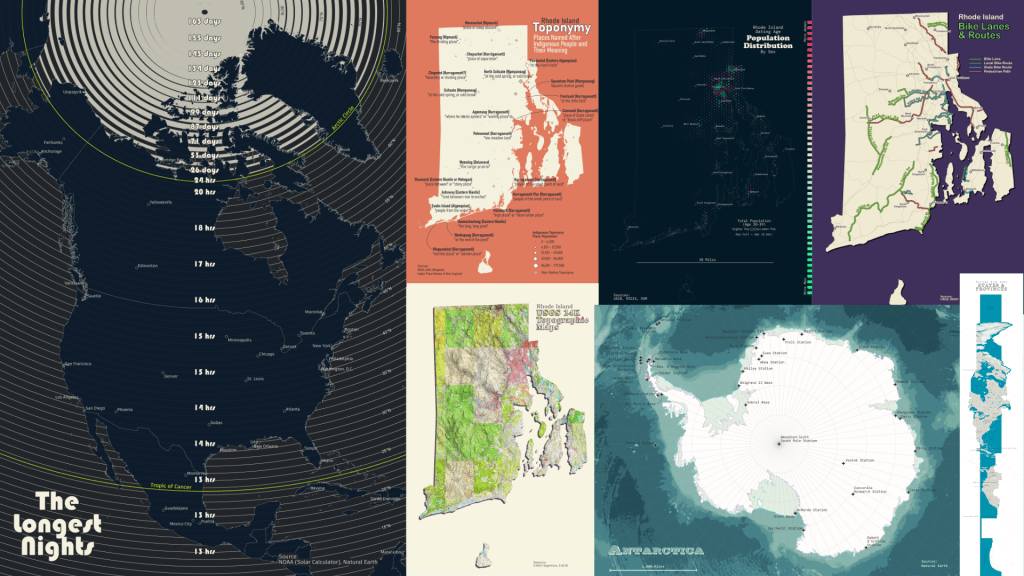
Week 4 Map Gallery
All maps were made with QGIS and Affinity Designer.

#Social Media (Bluesky)
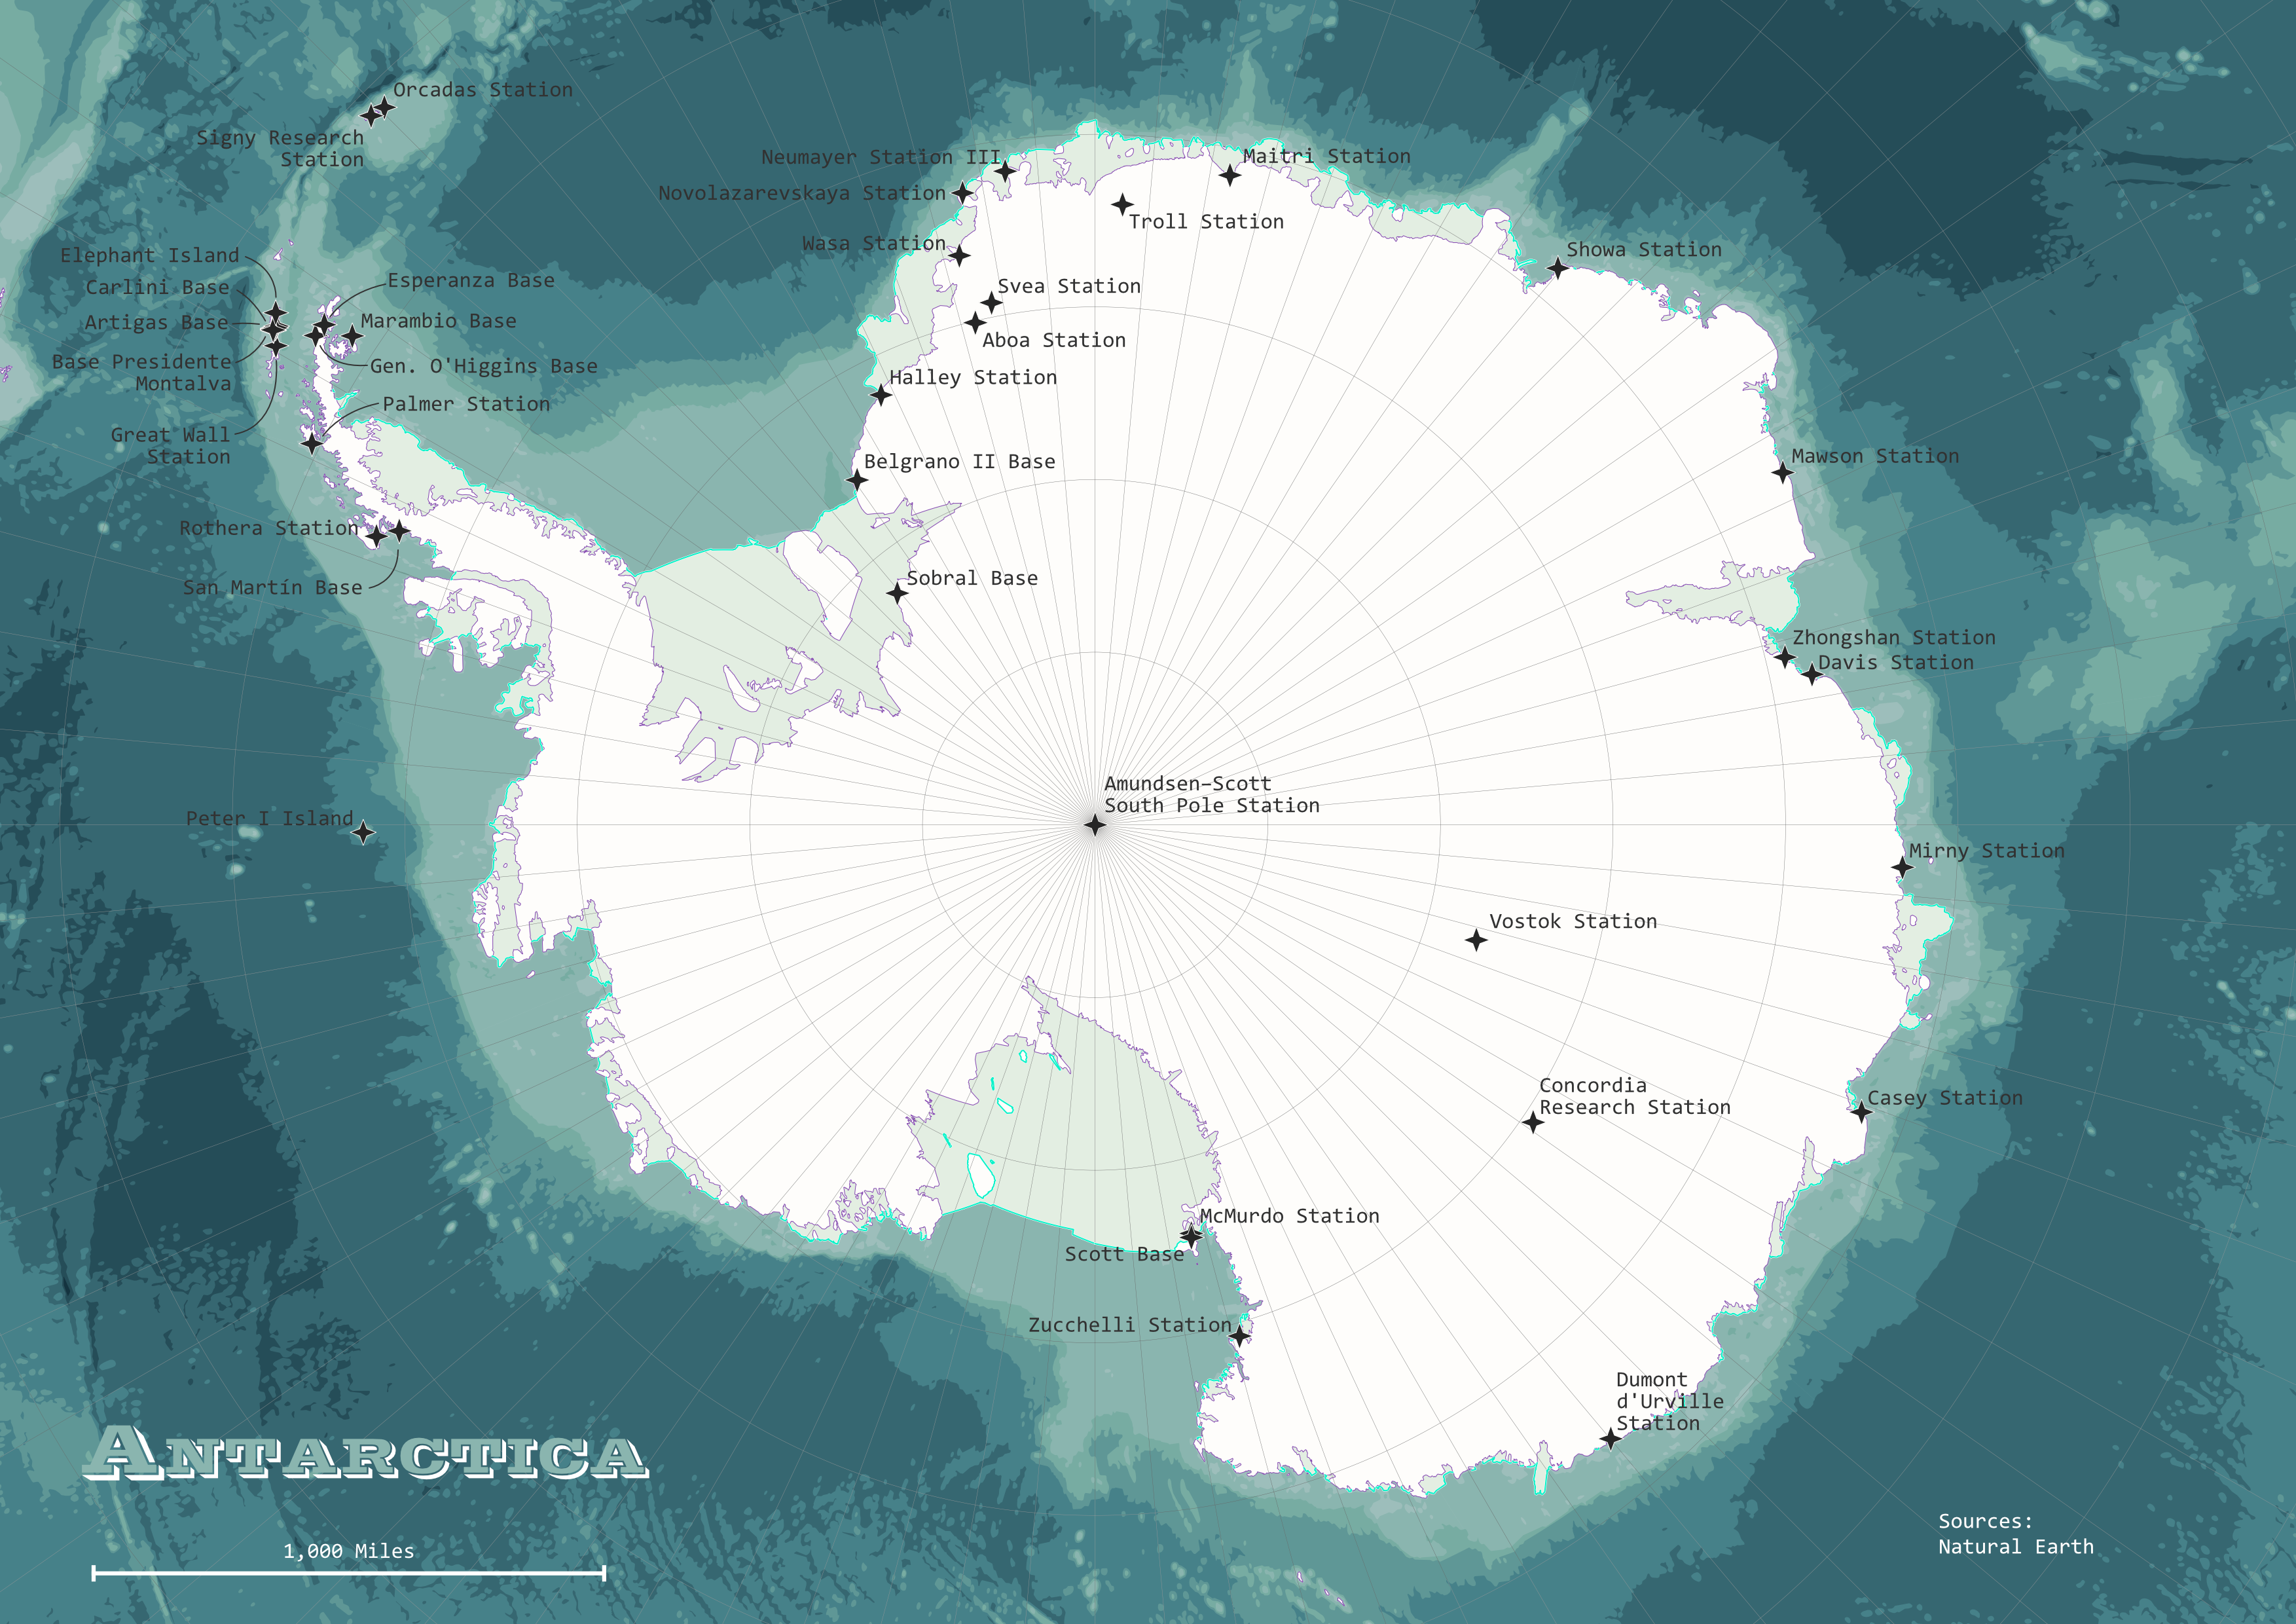
Day 22 – Natural Earth
Antarctica
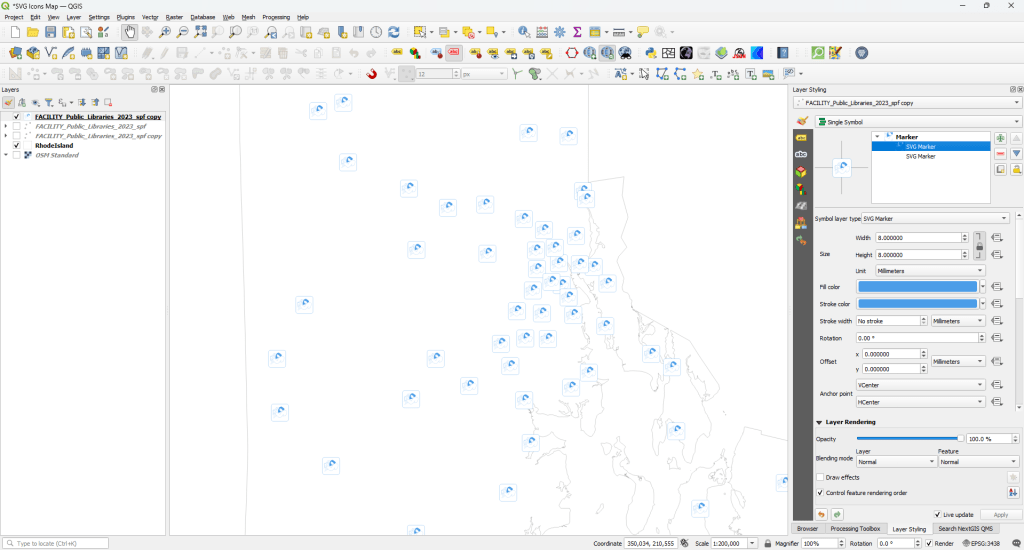
Day 23 – Process
Create a Joy Plot Map in QGIS
Direct link here…
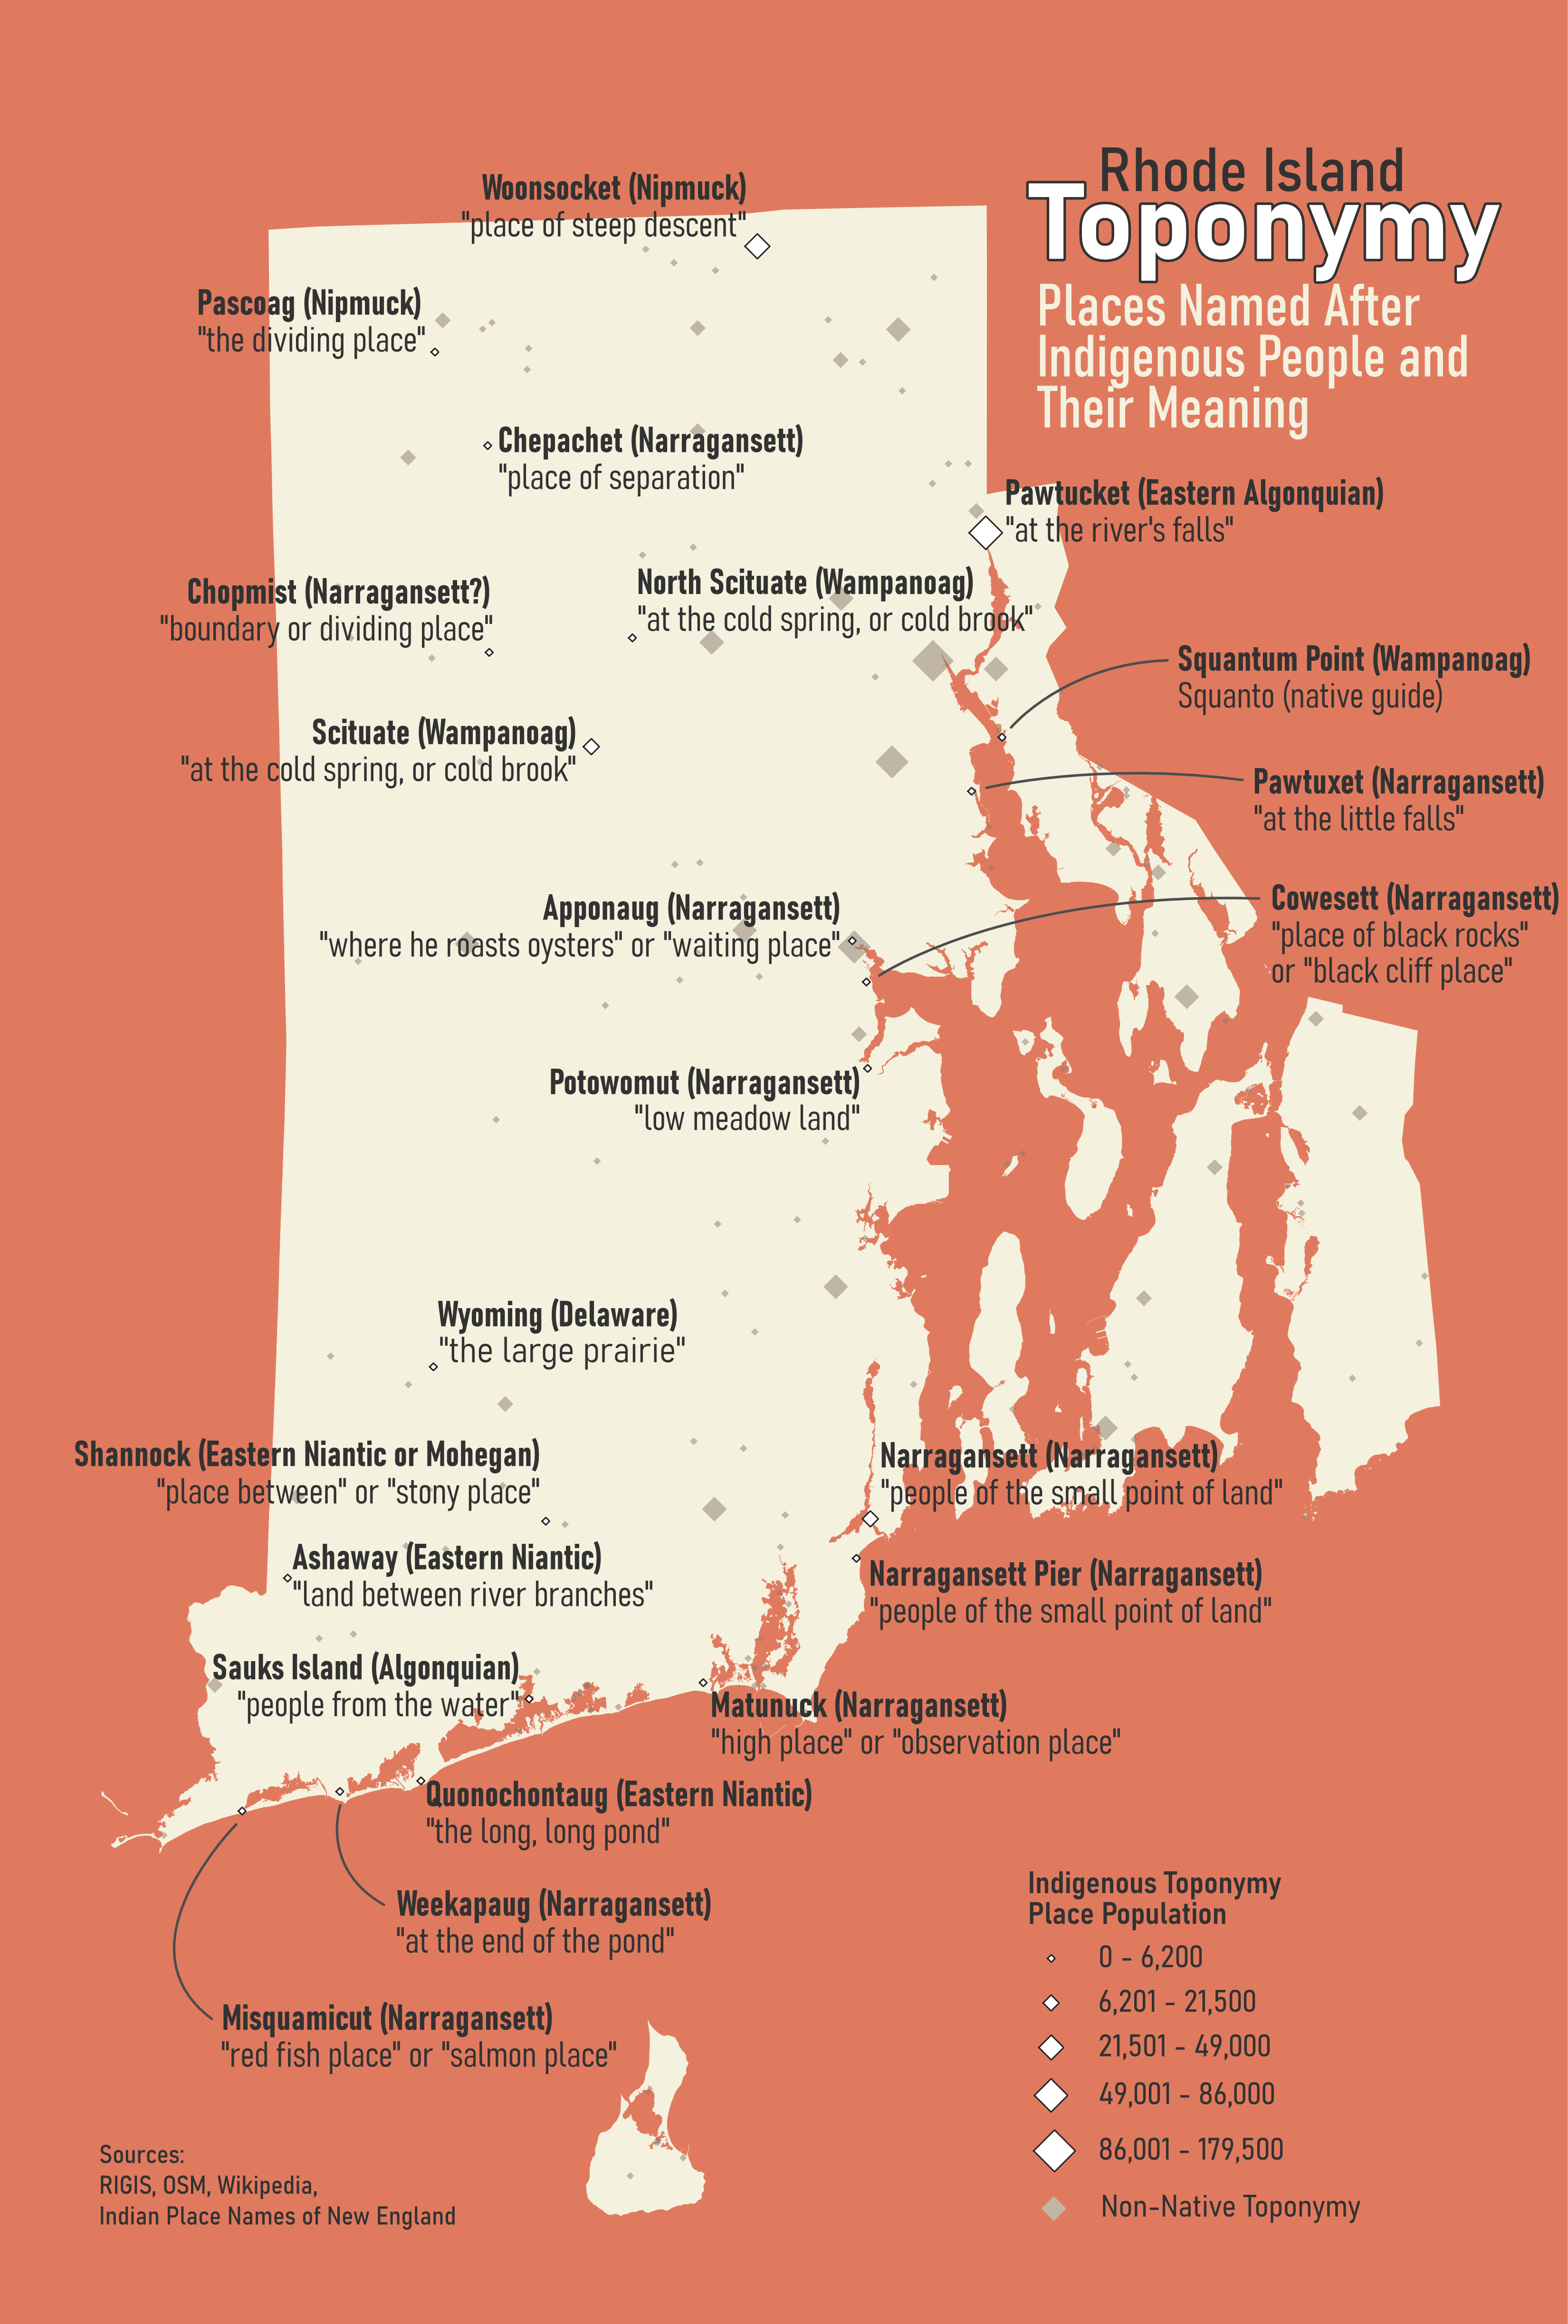
Day 24 – Toponymy
Rhode Island Indigenous Toponymy
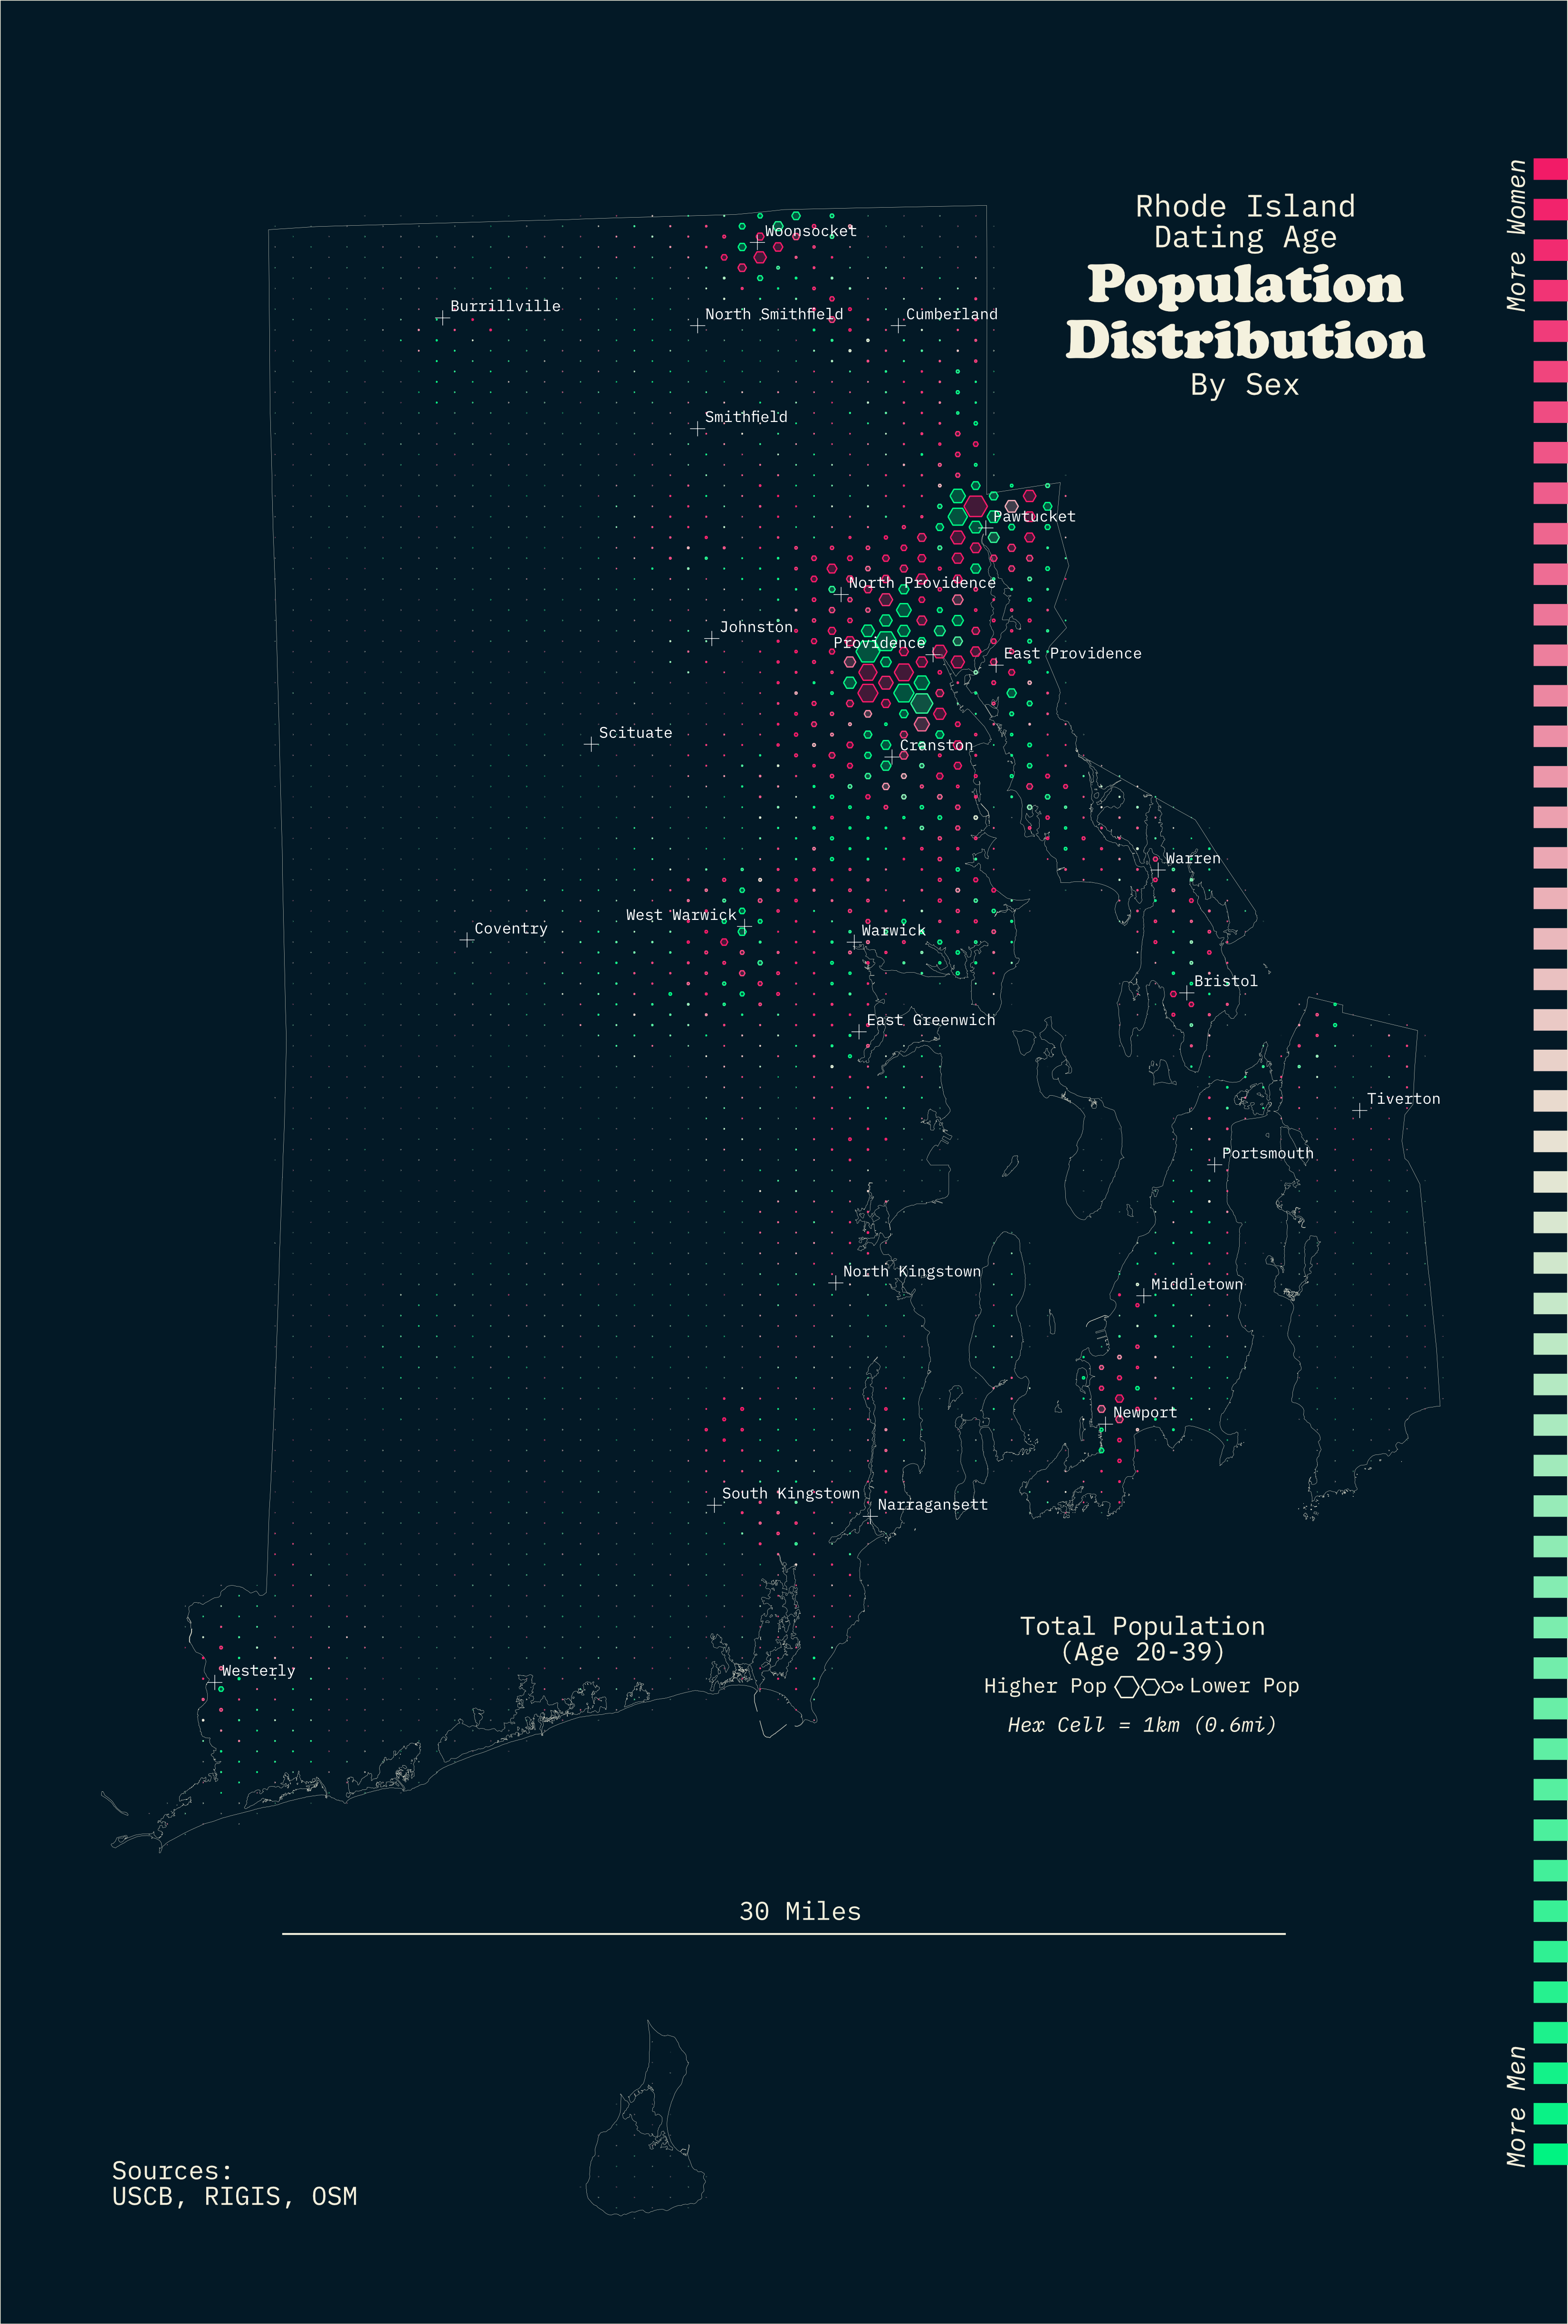
Day 25 – Hexagons
Rhode Island Dating Age Population Distribution
Day 26 – Transport
Rhode Island Bike Lanes & Routes
Day 27 – Boundaries
Eastern Standard Time Zone States and Provinces
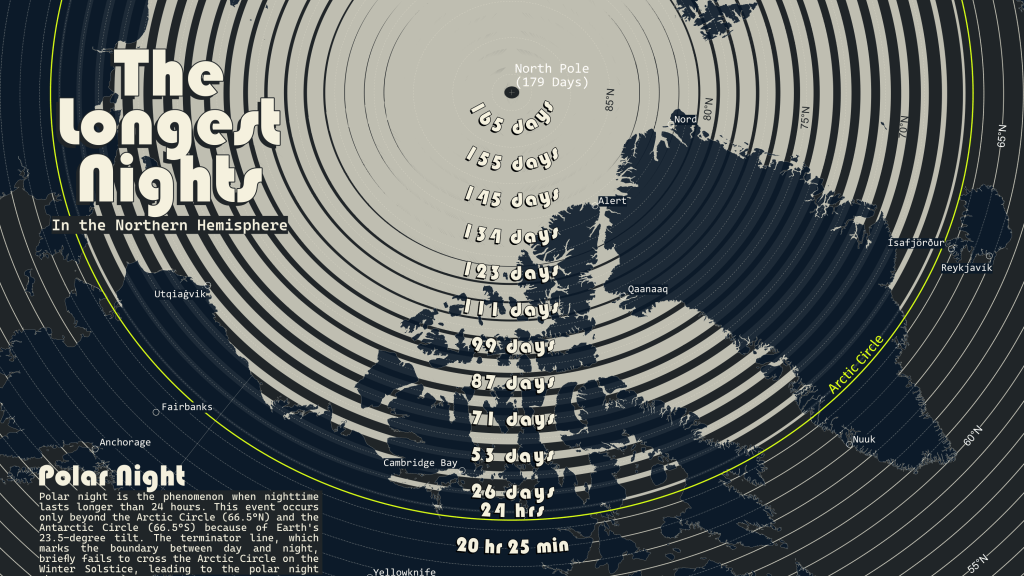
Day 28 – Black
The Longest Nights (2025)
Day 29 – Raster
Rhode Island 24k Topographic Maps
Day 30 – Makeover [Skipped]
Reflections
And that’s it! This year, I completed 28 out of 30 maps! Honestly, I had only planned to complete the first two weeks at the most. But the flow state happened, as well… things got out of hand. I am happy with how most of the maps turned out. Typically, I phone a few of them in just to stay on schedule.
As usual, I say this is the last time I will do the 30DayMapChallenge. It is a big commitment, and I don’t know if I can make any improvements in another challenge. This year, I was motivated by the need to develop more QGIS workflows and the desire to learn more about Rhode Island. Both of those goals were successful. I think I will need a similar pull to complete the challenge in full again.
If you have any questions about any of the maps I created, feel free to ask in the comments section, on Bluesky, or via email.
Linkedin vs Bluesky
I posted my maps on Bluesky and LinkedIn as kind of a test of where to focus my cartographic efforts moving forward. Personally, I dislike the algorithm on LinkedIn. Most of the posts I see are two weeks old, which is very annoying. The format platform itself is fine. Engagement is also way down from the previous 30DayMapChallenge. This is possibly due to LI pushing the premium “Insider” features.
Bluesky’s engagement was on average lower, but it felt more consistent, and I like the platform and the vibes. I feel like LI wants me to “boost” my posts to reach a certain audience. Engagement fluctuates between a handful of likes (3-5) to around 200, and definitely feels more asymmetrical compared to Bluesky.
That said, LI sent more people over for the Joy Plot Map workflow post. Like more than double. Which was surprising a first, but I get it now. Most people who follow me on LI are GIS people. And even though the total number of followers is similar on both platforms, I think a lot of people signed up for Bluesky but aren’t using it on a daily basis.
Moving forward, I will focus on Bluesky for day-to-day posts (maps, wips, tips, workflows). Any workflows or tutorials I create will be posted on both platforms. I will mainly use LinkedIn for my finalized maps.