As a frequent user of custom SVG symbols in ArcGIS Pro, I naturally wanted to use this method in QGIS. While you can import SVG files as symbols, the layer controls (fill and stroke colors, lineweights, etc.) are unavailable. This is due to some under-the-hood issues, which we will address in this workflow.
Workflow Note
This workflow assumes that you have a basic understanding of QGIS 3.44.
Introduction
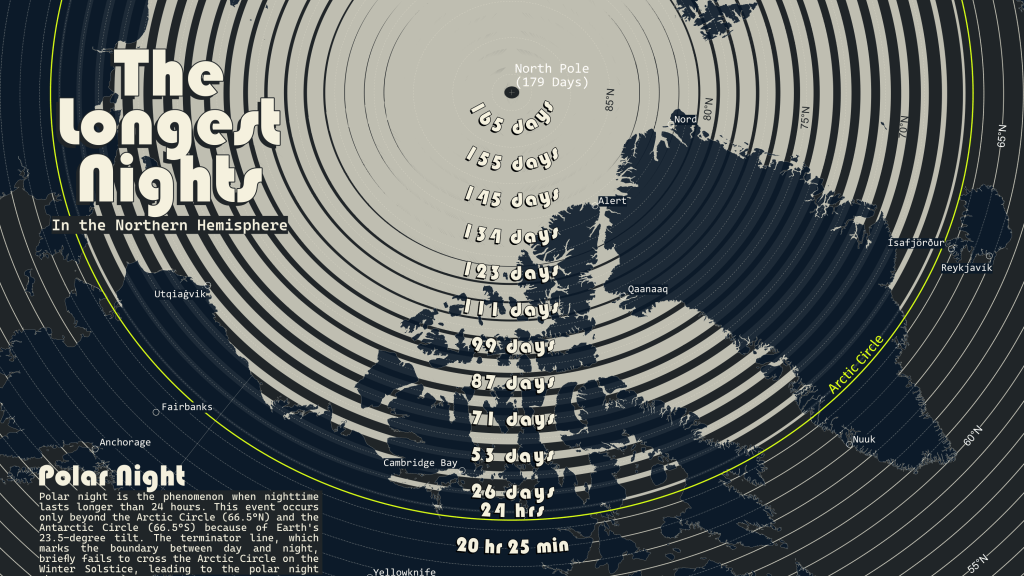
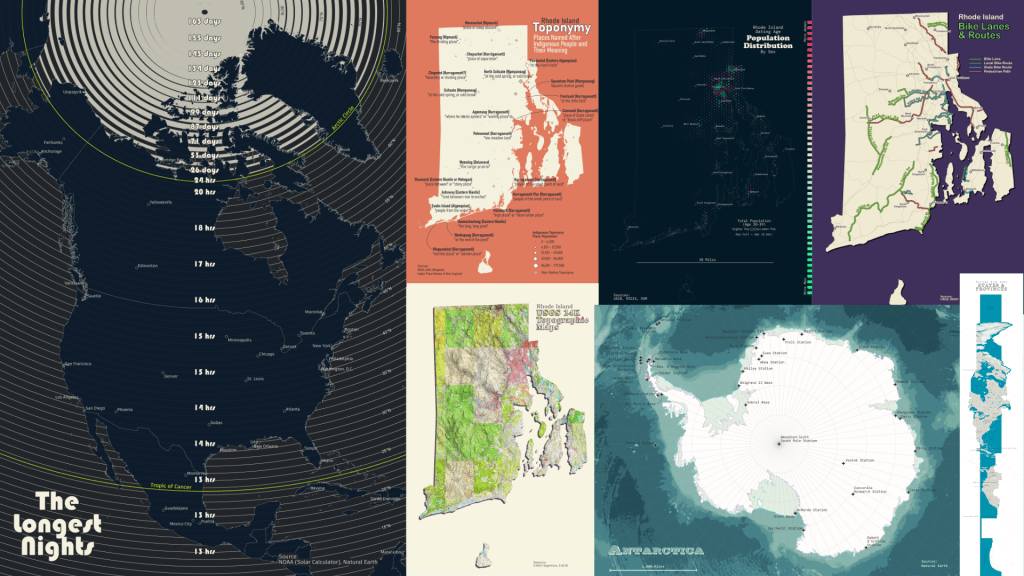
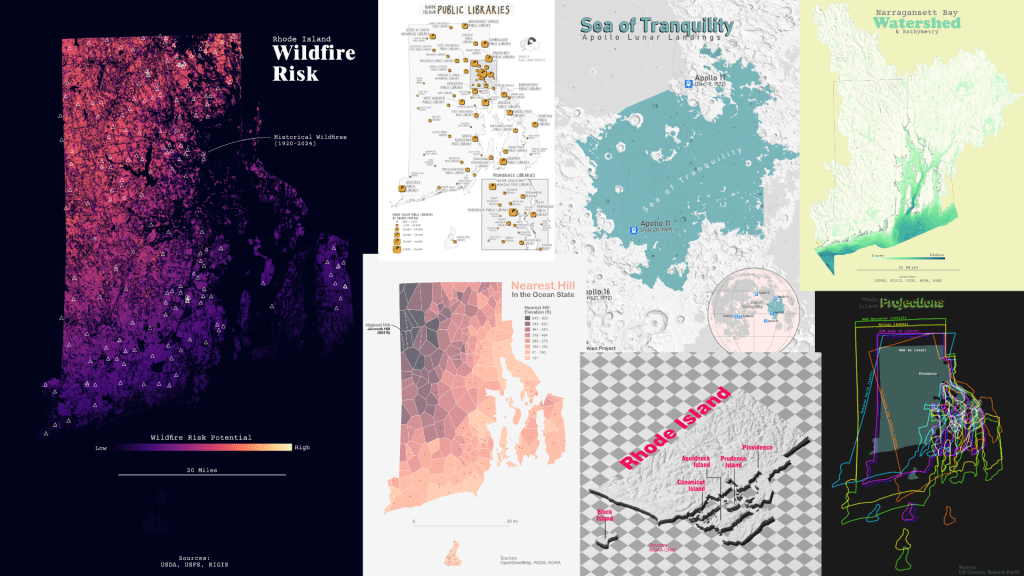
During the 2025 30DayMapChallenge, I created several maps that used SVG files for symbols. Most of which came from the Noun Project. The library icon in the Rhode Island Public Libraries map is by Mayang Aria from the Noun Project.

The Problem
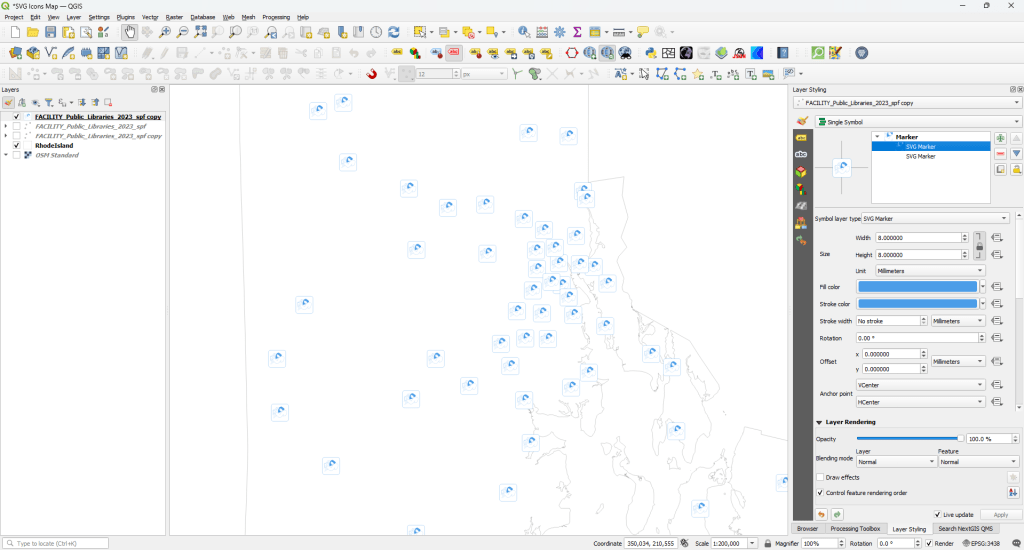
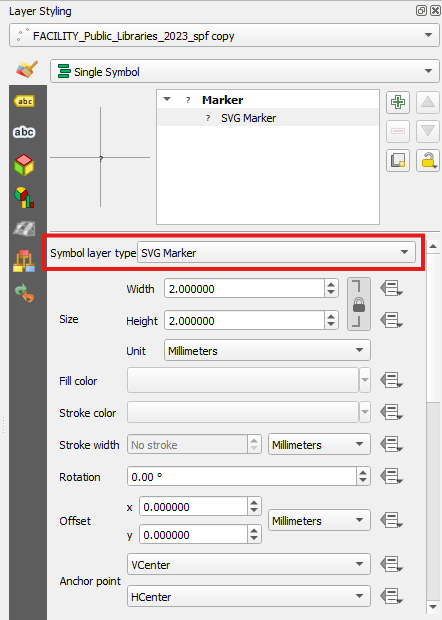
When we initially add the SVG file to the layer symbology, the fill color, stroke color, and stroke width options are unavailable for adjustment. We are stuck with whatever colors the SVG file was saved with.

To enable these options, we need to modify the SVG file.
Tip: How to Add a Custom SVG Symbol to QGIS
Under Layer Styling, change the Symbol layer type to SVG Marker.
Scroll down in the Layer Styling panel/window and click the Ellipsis to browse and select your SVG file.
Modify the SVG File
Open the SVG file in a text editor. In this case, I am using Notepad in Windows 11. Notepad++ is a good option to edit SVG XML elements.
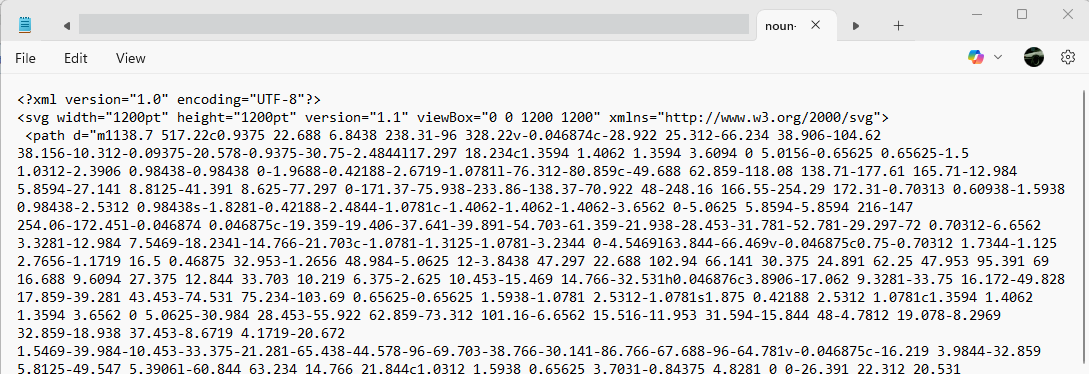
Locate the <svg> tag/element. In this case, it is on the second line. We will modify this element.

Insert the follow text just after the opening <svg> element. This will add variable parameters to the SVG element.
fill="param(fill)" stroke="param(outline)" stroke-
width="param(outline-width)"
The full <svg> line should look similar to this.
<svg fill="param(fill)" stroke="param(outline)" stroke-width="param(outline-width)" width="1200pt" height="1200pt" version="1.1" viewBox="0 0 1200 1200" xmlns="http://www.w3.org/2000/svg">However, if you want standardized control over the symbols, we can mix and match the parameters. Fill controls the fill color, stroke controls the stroke color, and stroke-width controls the line width.
Save the file (highly recommend saving as a copy to preserve your original).

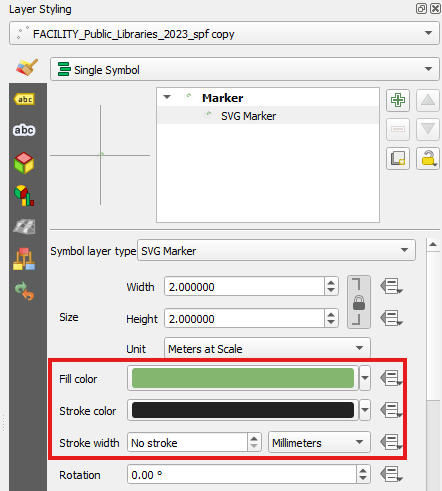
Add the modified SVG file as an SVG marker in QGIS. You should now have the option to change the Fill & Stroke colors and line weights.
Results
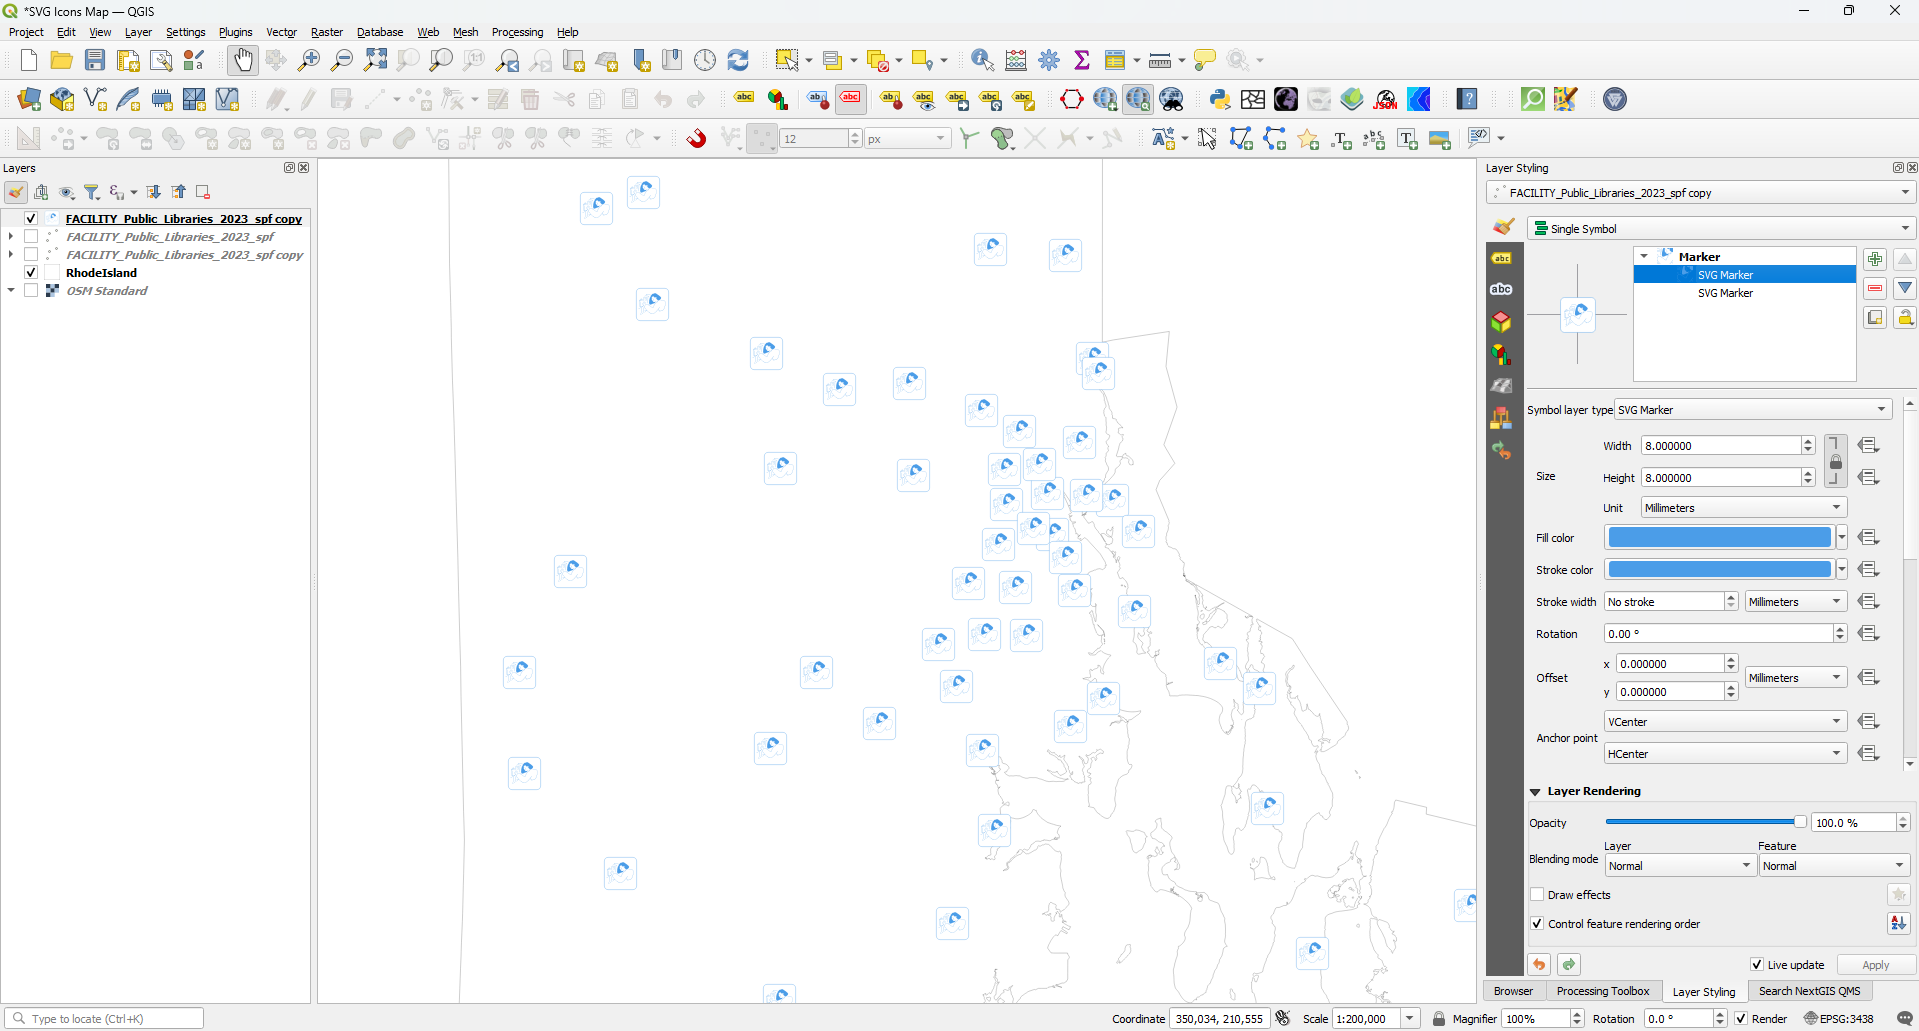
Adding a second symbol layer can create a more complex symbol. In this example, we used a rounded square SVG marker that is included with QGIS.
I also recommend using Millimeters as units over Meters at Scale, which can lead to unpredictable results.

That’s it!
References
https://gis.stackexchange.com/questions/305202/changing-colour-of-imported-svg-icon-in-qgis
Support
If you found any of these workflows helpful, consider buying me a coffee using the QR Code or link below. Thanks!