
Millennials everywhere!
As with most thematic maps I create, the question for this one was: “Where are the generations located in the United States?” In most cases, the answer to most population distribution questions is usually cities. People are usually located in cities in high numbers. Most thematic maps tend to reflect population density maps. Are you looking for the places with the most buildings? Chances are, the map will resemble a general population map.

For generational spatial distribution, the map is pretty similar to a population density map. It should be noted that the median generation is not necessarily the largest group; it is the middle group. The standard deviation of the median age would help us understand the distribution of median ages, but we don’t have that information.
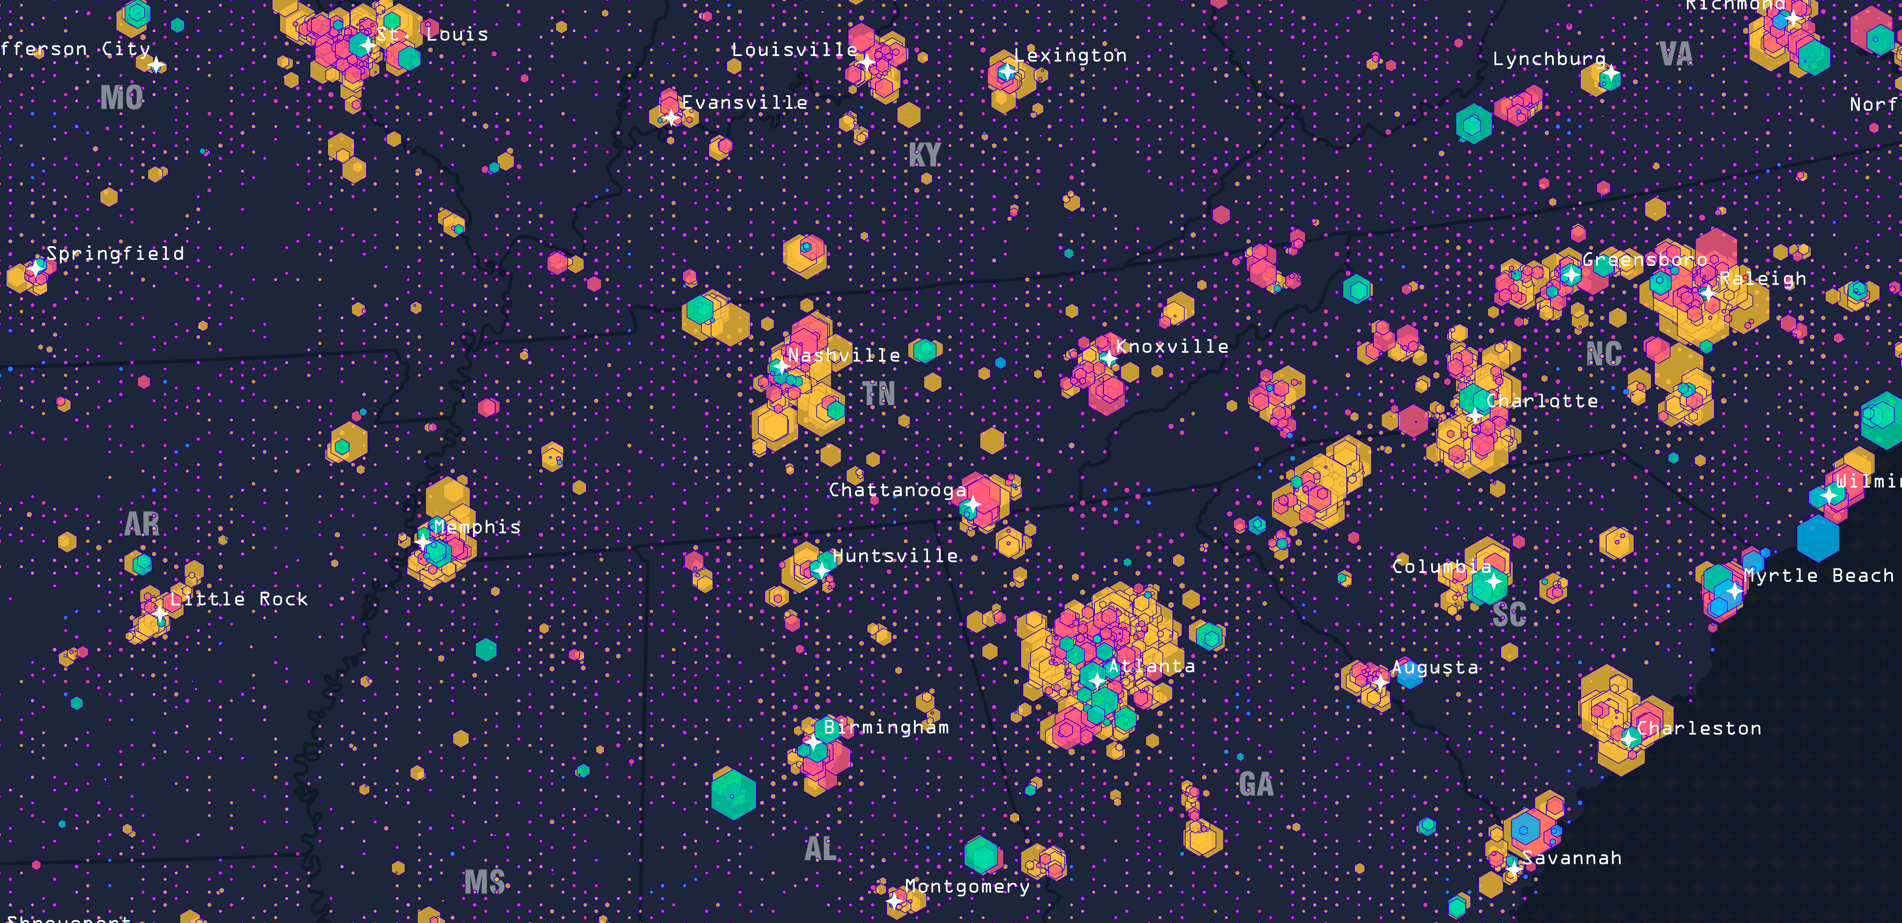
How to read the map
This map uses two cartographic methods to display proportional symbology. The urban areas (major and mid-major cities) use the underlying census tract centroids. Rural areas were very difficult to see without the grid, let alone determine which generation the symbol represented.

The generations are ordered from least common to most common. Boomers are shown at the top, followed by Gen Z, Gen X, and Millennials. The rural areas are shown using a 10-kilometer grid.

Background
In 2023, the national median age was the highest in United States history at 38.7 years, which corresponds to a Millennial (b. 1981-97) born in 1984. This was over twice the median age of the earliest records in 1820 (16.7 yrs). The low median age in the early 19th century was likely due to the high fertility rates in 1820, just under 7 births per woman, and an average life expectancy of around 40 years. Today, the average lifespan is around 70 years, and fertility rates are just under two per woman.
As Millennials became the median generation in 2020, they were also the oldest median generation in US history. By decade, Gen X (b. 1965-80) was the median generation from 2000 to 2020, and Baby Boomers (b. 1946-64) were the median generation in the prior two decades. Only the Greatest Generation (b. 1902-27) maintained a median generation run longer than two decades (1930-50). If the two decade trend holds, Millennials will be the median generation until 2040. Millennials are also the median generation in most states, except for 5 states (in order of oldest to youngest): Maine, New Hampshire, Vermont, West Virginia, and Florida, all of which were Gen X.
Most major cities have a broad base of Millennials throughout the area. Gen X is typically smaller than Millennials, but larger than the other median generations. Gen Z, the children of Gen X, is the next-largest group, followed by Boomers.


There is a smattering of Silent Gen (born 1928-45) tracts throughout the country. Like this one near Trenton, NJ. The populations are small as the youngest Silent Gens were 78 yrs old in 2023.

Not completely unexpected, but the coastal regions of Florida have the highest concentration of median Boomers in the country.

Gen Z has a relatively high concentration in Salt Lake City and Provo, Utah. This may be due to the high concentration of Mormons in the area, who typically have higher fertility rates than the national average.

Idaho Falls also has a high proportion of Mormons and a high concentration of the median Gen Z population.

Next Steps
I originally made this map for a contest; however, I missed the submission deadline. I would love to map the total generation populations using the enumeration values from the Census data. One issue is that the Census has age breaks. Under 5, 5-9, 11-14, 18-24, 25-29, and so on. If a generation falls in the middle of those age ranges, how do we split it? The simplest answer is probably to split the populations proportionally, but I’m not sure yet. I am open to any suggestions.
Additional Information
National Median Age & Generation by Decade
| Year | Median Age | Generation |
|---|---|---|
| 2020 | 38.2 | Millennial |
| 2010 | 36.9 | Gen X |
| 2000 | 35.3 | Gen X |
| 1990 | 32.9 | Boomer |
| 1980 | 30.0 | Boomer |
| 1970 | 28.1 | Slient |
| 1960 | 29.6 | Silent |
| 1950 | 30.2 | Greatest |
| 1940 | 29.0 | Greatest |
| 1930 | 26.5 | Greatest |
| 1920 | 25.3 | Lost |
| 1910 | 24.1 | Lost |
| 1900 | 22.9 | |
| 1890 | 22.0 | |
| 1880 | 20.9 | |
| 1870 | 20.2 | |
| 1860 | 19.4 | |
| 1850 | 18.9 | |
| 1840 | 17.8 | |
| 1830 | 17.2 | |
| 1820 | 16.7 |
State-Level Median Age and Generation (2023)
| State | Median Age | Generation |
|---|---|---|
| Maine | 44.8 | Gen X |
| Puerto Rico | 44.2 | Gen X |
| New Hampshire | 43.2 | Gen X |
| Vermont | 43 | Gen X |
| West Virginia | 42.7 | Gen X |
| Florida | 42.6 | Gen X |
| Delaware | 41.5 | Millennial |
| Connecticut | 41.2 | Millennial |
| Pennsylvania | 40.9 | Millennial |
| Hawaii | 40.6 | Millennial |
| Rhode Island | 40.5 | Millennial |
| Montana | 40.2 | Millennial |
| Michigan | 40.1 | Millennial |
| New Jersey | 40.1 | Millennial |
| Oregon | 40.1 | Millennial |
| South Carolina | 40.1 | Millennial |
| Wisconsin | 40.1 | Millennial |
| Massachusetts | 40 | Millennial |
| New York | 39.6 | Millennial |
| Ohio | 39.6 | Millennial |
| Alabama | 39.3 | Millennial |
| Maryland | 39.3 | Millennial |
| New Mexico | 39.2 | Millennial |
| Kentucky | 39.1 | Millennial |
| North Carolina | 39.1 | Millennial |
| Illinois | 38.9 | Millennial |
| Missouri | 38.9 | Millennial |
| Nevada | 38.9 | Millennial |
| Tennessee | 38.9 | Millennial |
| Arizona | 38.8 | Millennial |
| Virginia | 38.8 | Millennial |
| Wyoming | 38.8 | Millennial |
| Iowa | 38.6 | Millennial |
| Minnesota | 38.6 | Millennial |
| Arkansas | 38.4 | Millennial |
| Mississippi | 38.4 | Millennial |
| Washington | 38.2 | Millennial |
| Indiana | 38 | Millennial |
| Louisiana | 37.8 | Millennial |
| South Dakota | 37.7 | Millennial |
| California | 37.6 | Millennial |
| Colorado | 37.5 | Millennial |
| Georgia | 37.4 | Millennial |
| Kansas | 37.2 | Millennial |
| Idaho | 37.1 | Millennial |
| Nebraska | 37.1 | Millennial |
| Oklahoma | 36.9 | Millennial |
| North Dakota | 35.7 | Millennial |
| Alaska | 35.6 | Millennial |
| Texas | 35.5 | Millennial |
| District of Columbia | 34.9 | Millennial |
| Utah | 31.7 | Millennial |