
Four years ago, I read the results of a survey that put me in disbelief. Americans estimated that black people were over 40 percent of the US population! The actual number is 12 to 13 percent. In fairness, Americans also overestimated other minorities and marginalized groups. In fact, the overestimation of small groups seems to be a global phenomenon. Further, this overestimation of the proportion of the black population applies to black and white Americans.
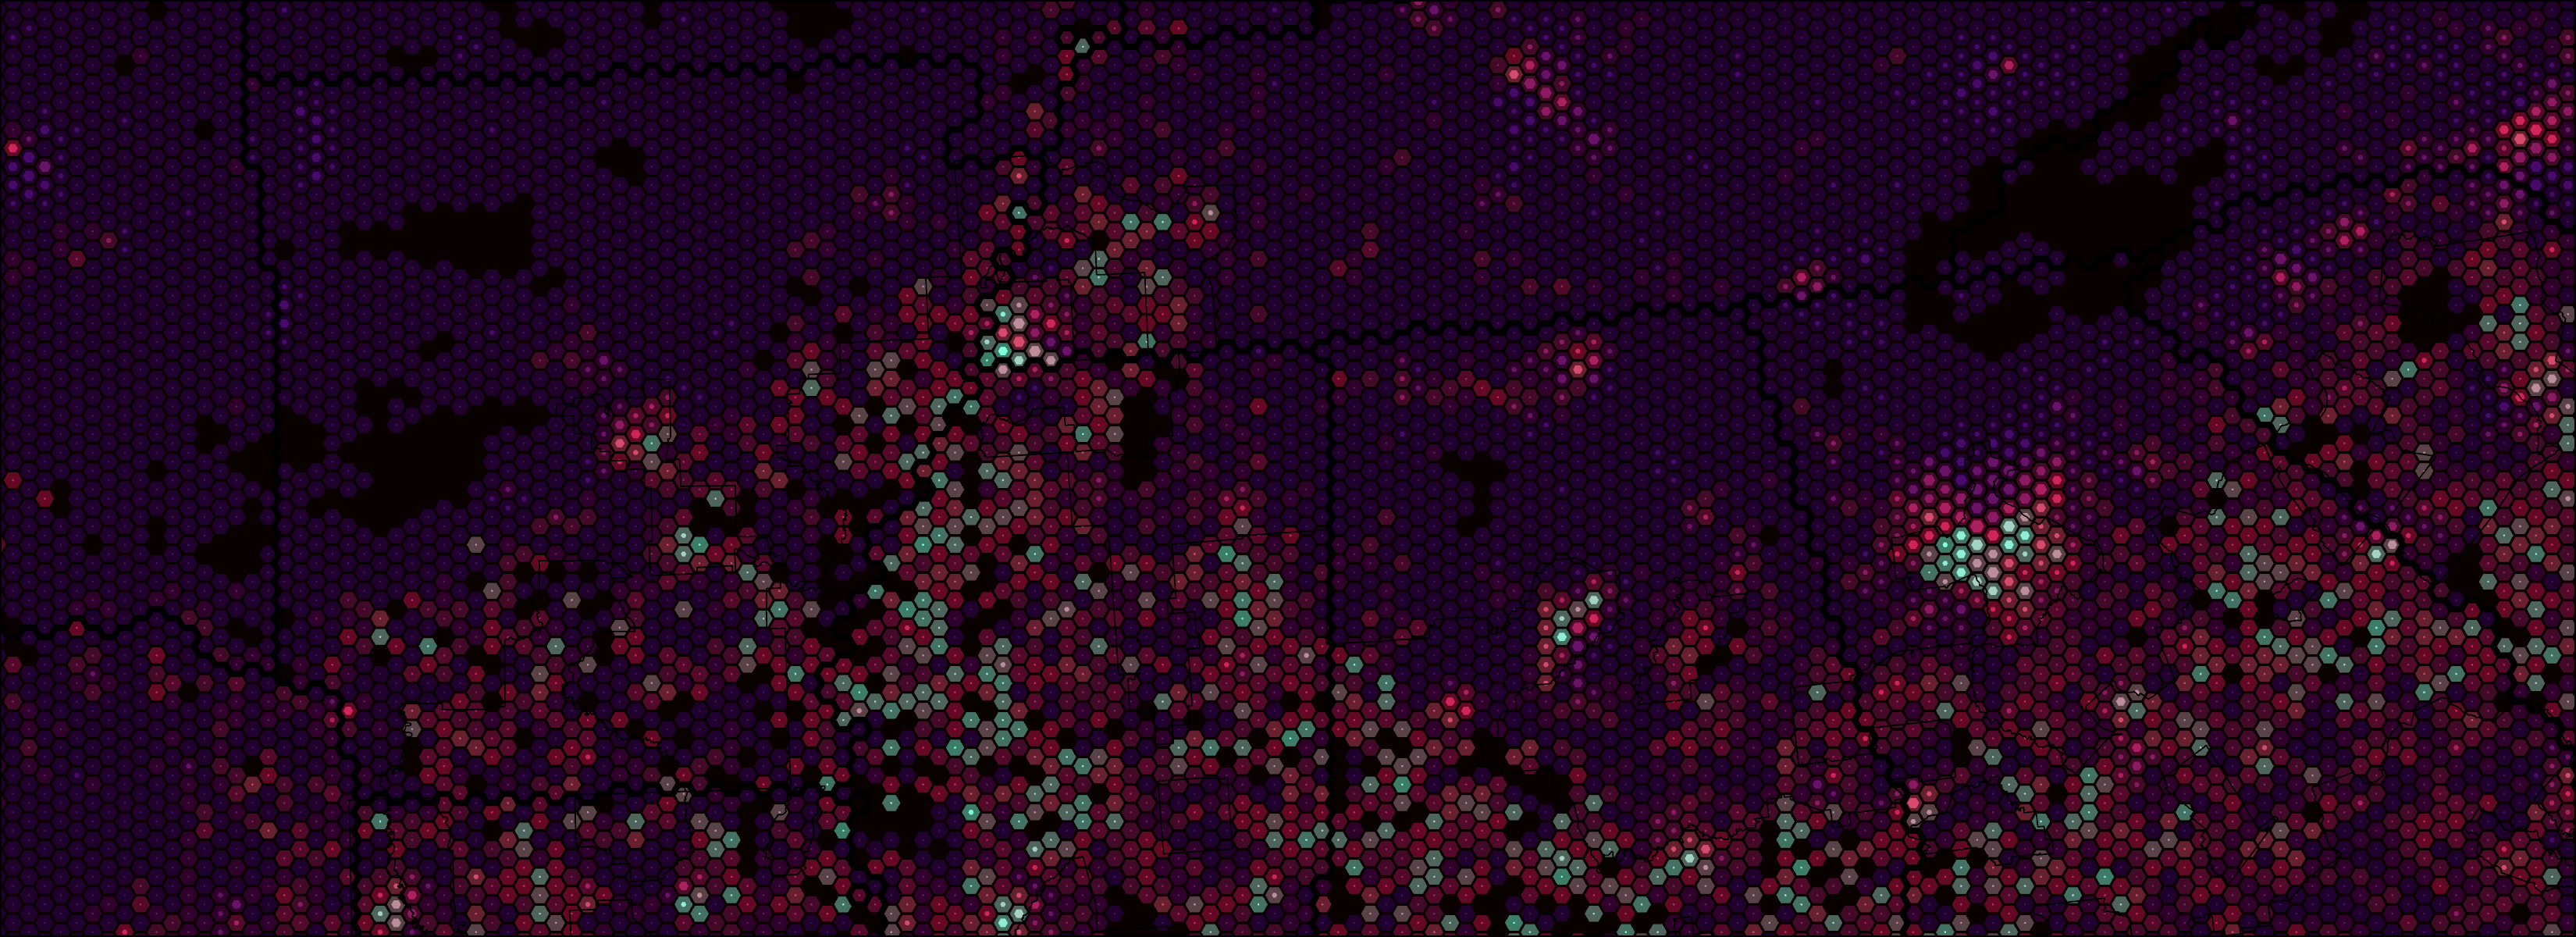
I decided to explore the data for spatial patterns, as national averages can mask local trends. Using census tract population data from the 2024 American Community Survey (ACS) to create hex grid-based Wurman Dots.

National Level: 12%
As of 2024, there are approximately 42 million black Americans living in the United States, accounting for roughly 12% of the total population. The high concentration/relatively low population of black people in the Deep South is a demographic imprint of American slavery.

Regional Level: 19 to 5%
For most of American history, 90% of black Americans lived in the American South. By the end of the First Great Migration (1910-1940), the proportion of the black population in the South dropped to around 60%. Today, the South holds the largest proportion of the black population at 56%. It reached a low of 53% in the 70s before rebounding in the 2000s. The Midwest and Northeast are tied at 17%, and 10% of the black population lives in the West. While most black people live in the South, they make up only 19% of the South’s total population. Around 11% of the Northeast population is black, 10% for the Midwest, and 5% for the West.

State Level: 36 to >1%


At the state level, the black population ranges from 42% in the District of Columbia to less than 1% in Montana. The ten states with the highest concentration of black populations are located in the South. While most people don’t consider Maryland and Delaware part of the “South” (the author included), both states were former slave states during the Civil War and are located below the Mason-Dixon line. They also share a latitude with West Virginia and Kentucky.
| State | Black Pct | State Pop |
|---|---|---|
| D.C. | 42% | 681,000 |
| Mississippi | 36% | 2,950,000 |
| Georgia | 31% | 10,940,000 |
| Louisiana | 31% | 4,610,000 |
| Maryland | 29% | 6,210,000 |
| Alabama | 26% | 5,100,000 |
| South Carolina | 25% | 5,300,000 |
| Delaware | 22% | 1,000,000 |
| North Carolina | 20% | 10,730,000 |
| Virginia | 19% | 8,710,000 |
| Tennessee | 16% | 7,000,000 |
Urban Level: 54 to 0%


The black population varies the most at the local level, which is true for most population averages. The Vicksburg, MS urban area, west of Jackson, MS, has the highest proportion of black people at 54%. Most of the urban areas with the highest proportions of black populations are located in Southern states, creating the Black Belt. Many of these high black proportion locations have relatively small populations. As with most population dynamics, black people are no different. Most black people live in cities. Even in the American South.
| Urban Area | Black Pct |
|---|---|
| Vicksburg, MS | 54% |
| Albany, GA | 53% |
| Waldorf, MD | 49% |
| Rocky Mount, NC | 47% |
| Memphis, TN | 46% |
| Meridian, MS | 46% |
| Florence, SC | 45% |
| Macon, GA | 45% |
| Sumter, SC | 43% |
| Montgomery, AL | 41% |
Tools & Methods
ArcGIS Pro & Affinity Studio
Dasymetric Mapping, Hex Binning, and Wurman Dots